Introduction
In fast-moving markets, the difference between a winning trade and a frustrating loss often comes down to timing. That’s where vwap becomes a powerful ally. Short for Volume Weighted Average Price, this simple yet deeply insightful indicator helps traders understand where the “fair value” of a stock lies during the trading session.
If you’ve ever wondered how institutional traders decide whether a price is expensive or cheap intraday, you’re not alone. Many professionals use vwap as a benchmark to guide entries, exits, and overall bias. Understanding it can change the way you look at charts forever.
Whether you’re a beginner exploring technical indicators or an experienced trader refining your edge, mastering this concept matters. It adds context to price action, improves discipline, and helps you avoid chasing emotional moves.
What Is VWAP and Why It Matters
Clear Definition of vwap
vwap stands for Volume Weighted Average Price. It calculates the average price of a security throughout the trading day, weighted by volume. Unlike a simple moving average, it gives more importance to prices where higher trading volume occurred.
In plain terms:
It shows the average price traders have paid for a stock during the day, considering how many shares were traded at each price.
Because volume reflects participation and conviction, this indicator paints a more accurate picture of true market value.
After two strong opening candles, traders often glance at the line to assess whether price is extended or still trading near fair value.


Why Institutional Traders Respect It
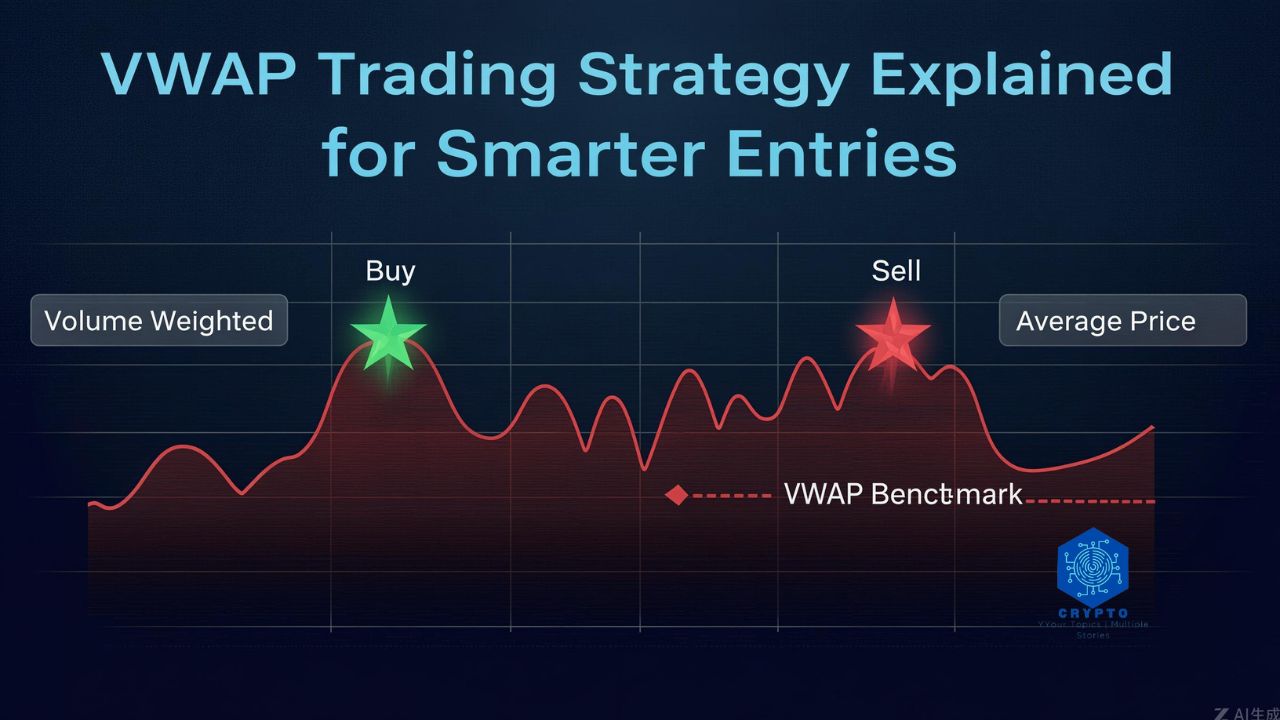
Large institutions aim to buy below the average price and sell above it during the session. That average is frequently measured against vwap. If they consistently execute better than that benchmark, they demonstrate efficiency.
For individual traders, this creates opportunity. When price trades significantly above the line, it may signal overextension. When it pulls back toward it in a strong trend, it can present a high-probability entry.
How VWAP Is Calculated
Understanding the math builds confidence in how the indicator behaves.
The formula:
- Multiply each trade price by its volume.
- Add those values cumulatively.
- Divide by total cumulative volume.
In simplified terms:
- Typical Price = (High + Low + Close) / 3
- Multiply Typical Price by Volume
- Keep a running total
- Divide by total volume so far
Because it resets each trading day, vwap is primarily an intraday tool. It reflects real-time equilibrium rather than long-term trends.
Using VWAP in Intraday Trading
Trend Confirmation
One of the simplest strategies is trend bias:
- Price above the line → Bullish bias
- Price below the line → Bearish bias
This doesn’t mean buying blindly above it. Instead, it helps frame direction. If the market is holding above average value, buyers are in control.
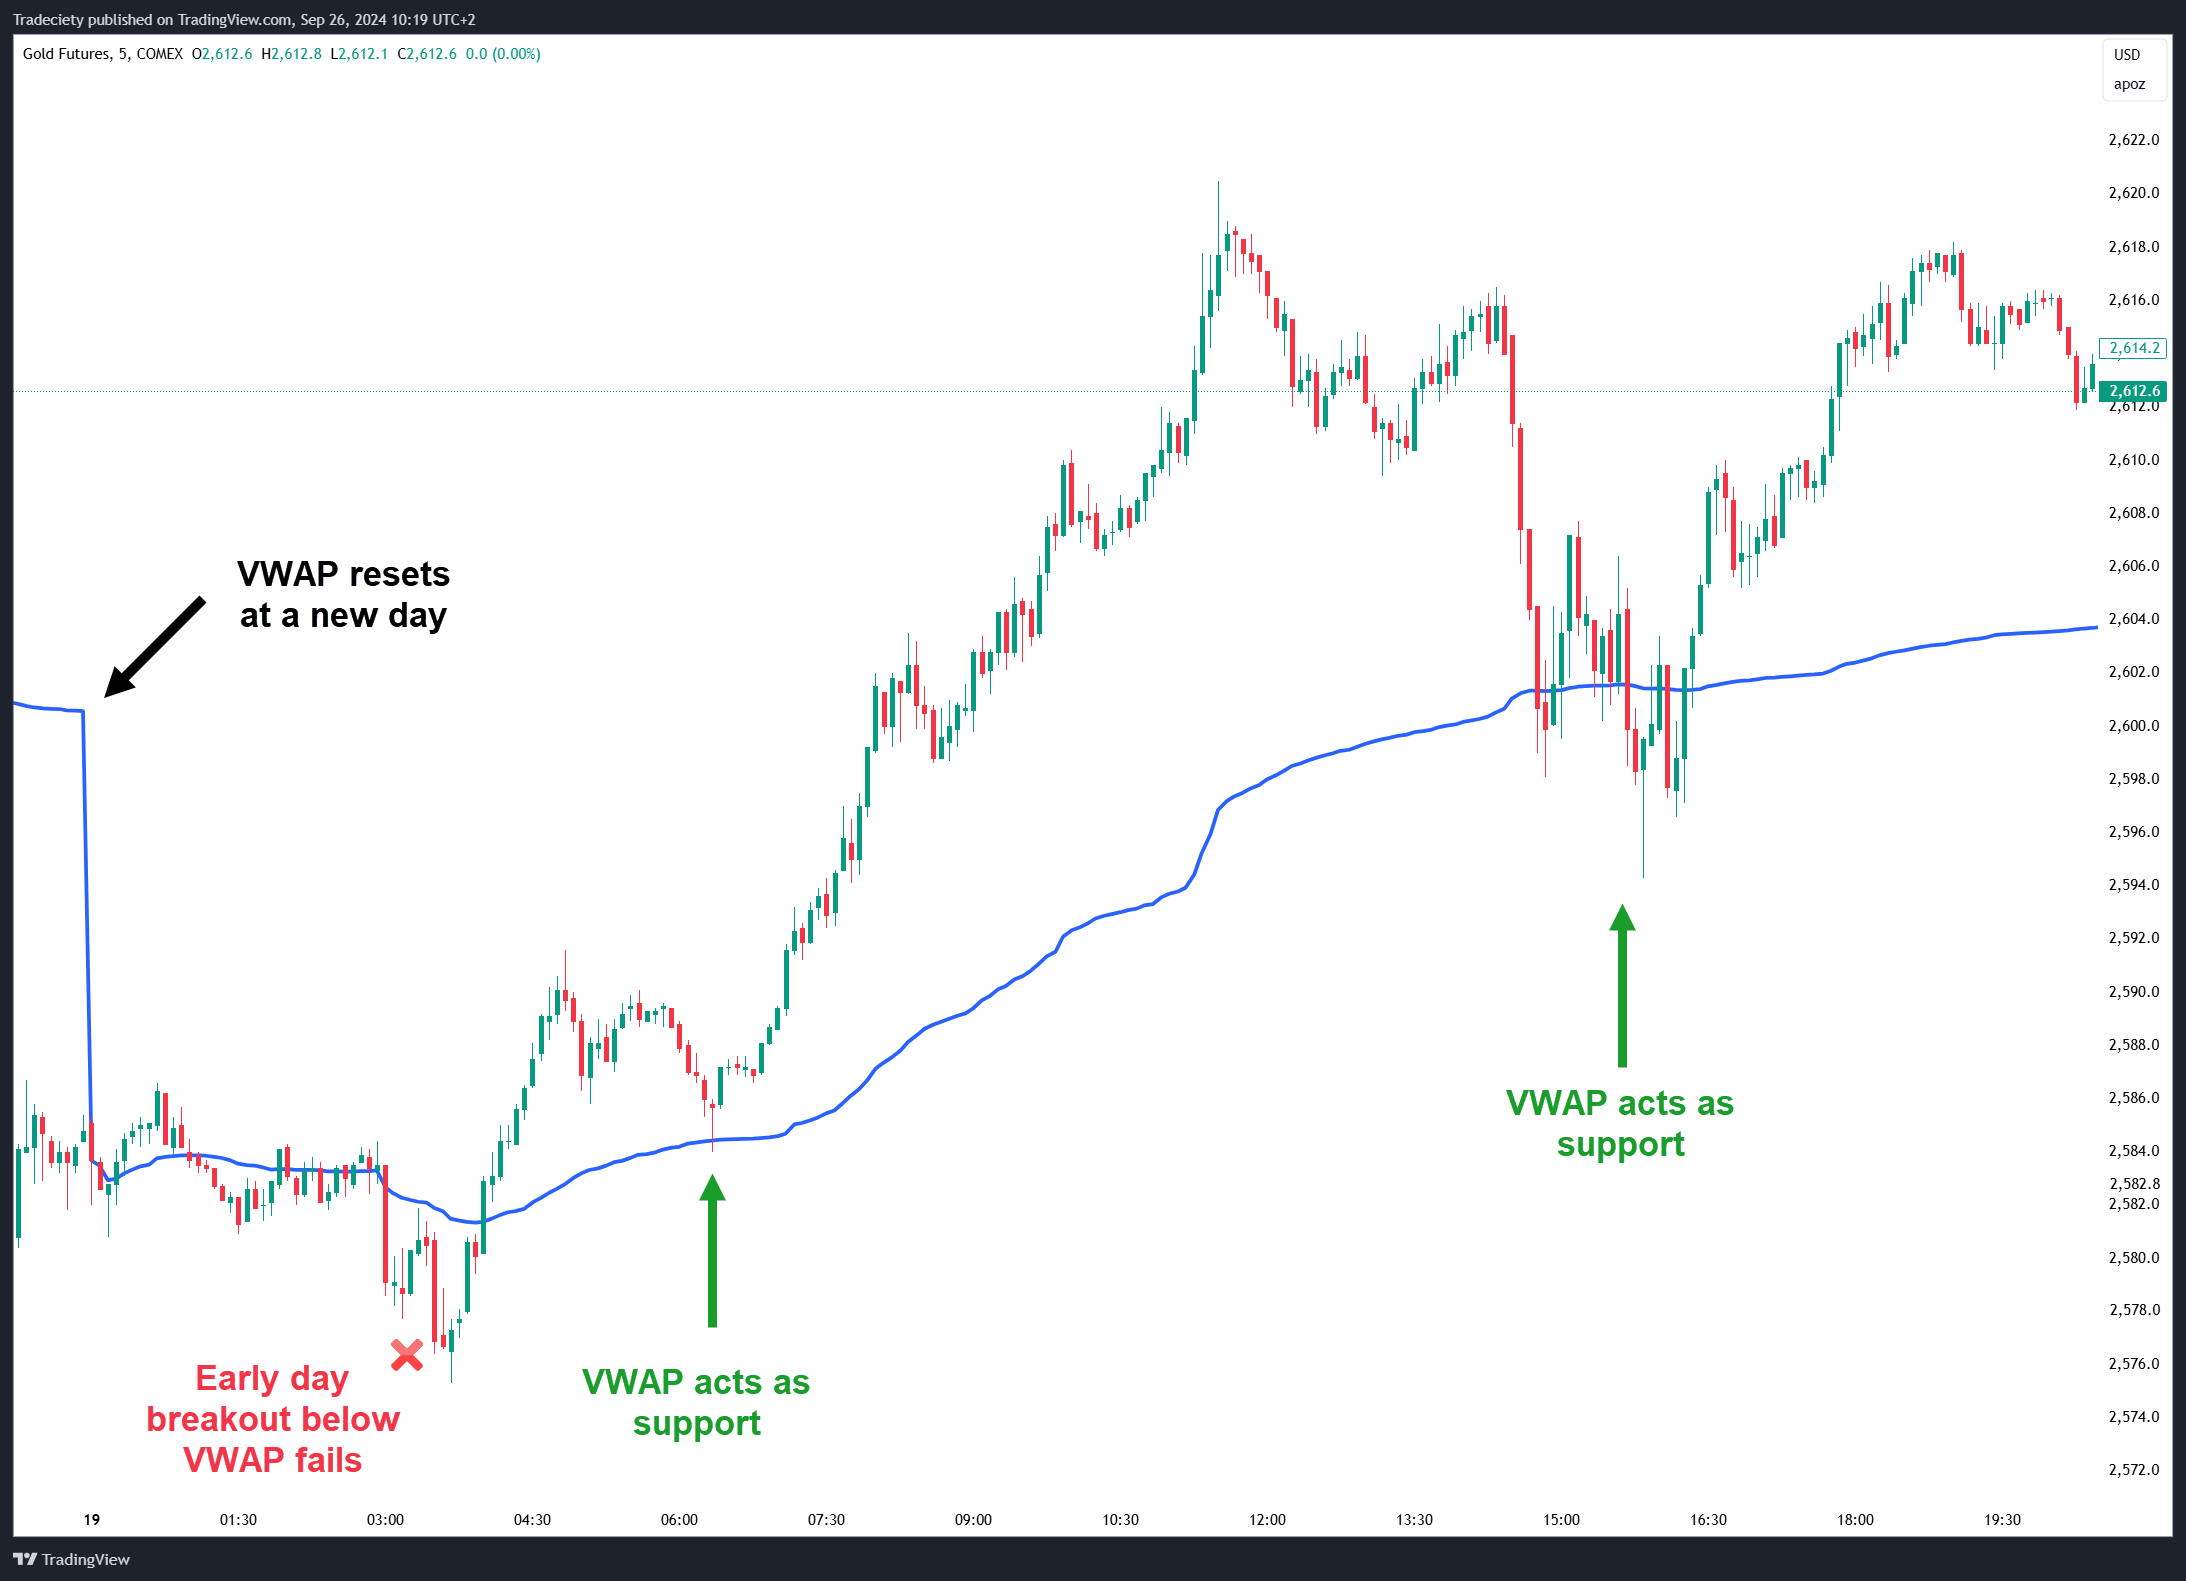
Pullback Entries
In strong trends, price often retraces toward vwap before continuing. These pullbacks can act like dynamic support or resistance.
For example:
- In an uptrend, price dips to the line.
- Buyers step in.
- A higher low forms.
- Momentum resumes upward.

This setup is popular because it offers:
- Defined risk
- Logical stop placement
- Clear invalidation if price loses structure
VWAP Bands and Extensions
Some traders add standard deviation bands around vwap. These bands measure how far price has stretched from average value.
When price moves two standard deviations away, it may signal:
- Overbought conditions (above upper band)
- Oversold conditions (below lower band)
However, in strong trends, price can “ride the band.” Context matters. News events, market sentiment, and overall volatility influence interpretation.
Anchored VWAP Explained
While standard vwap resets daily, Anchored VWAP allows traders to start calculations from a specific event:
- Earnings release
- Major breakout
- Gap open
- Swing high or low
This version provides insight into average price since a meaningful moment. It’s particularly useful for swing traders and position traders analyzing longer timeframes.


Anchoring to a major breakout can show whether institutions are still holding profitable positions or trapped.
Common VWAP Trading Strategies
1. Opening Drive Strategy
The first 30–60 minutes often set the tone.
If price:
- Breaks above it with strong volume
- Holds above on pullbacks
This can signal a continuation day.
2. VWAP Reversion Strategy
In choppy markets, price frequently oscillates around the line.
Traders:
- Sell extended moves above
- Buy extended moves below
- Target mean reversion
This works best in range-bound sessions.
3. Break and Hold Strategy
When price crosses the line and then retests it successfully, it can signal a shift in intraday control.
Key elements:
- Strong volume
- Clean retest
- Higher low or lower high confirmation
Psychological Edge of VWAP
Trading isn’t just technical—it’s psychological.
Knowing where average participants entered positions gives clarity:
- If price is far above average cost, late buyers may hesitate.
- If price drops below average, trapped traders may sell rallies.
This creates predictable reactions. Instead of guessing, you align with crowd behavior.
Risk Management With VWAP
No indicator guarantees profits. Smart traders combine it with:
- Stop-loss rules
- Position sizing discipline
- Broader market context
For example:
- Enter on a pullback.
- Place stop slightly below structure.
- Risk a fixed percentage of capital.
It should guide decisions—not replace risk management.
Common Mistakes Traders Make
- Using vwap on daily charts expecting long-term signals
- Ignoring volume confirmation
- Trading against strong macro trends
- Entering without confirmation candles
- Over-relying on it without price structure
Indicators work best when combined with market context.
Combining VWAP With Other Tools
It pairs effectively with:
- Moving averages
- Relative strength indicators
- Market profile
- Order flow tools
For example:
If price is above the line and forming higher highs while volume increases, alignment strengthens the setup.
Confluence improves probability.
FAQ
Frequently Asked Questions
Is VWAP better than moving averages?
It serves a different purpose. Moving averages track historical price trends over time, while vwap reflects real-time average value weighted by volume within a session.
Can swing traders use VWAP?
Yes, especially Anchored VWAP. It can be applied to major swing points for longer-term analysis.
Does VWAP work in crypto markets?
Yes. Since crypto trades 24/7, many traders use daily resets or anchor it to specific events.
What timeframe works best?
It’s primarily an intraday indicator, most effective on 1-minute to 15-minute charts.
Why does price respect VWAP so often?
Because institutions monitor it. Large volume participation around average price creates natural reaction zones.
Should beginners rely only on VWAP?
No. It should complement broader technical and risk management principles.
How many times should VWAP be tested before failing?
There’s no fixed number. Market structure and momentum matter more than count.
Is VWAP useful during high-impact news?
It can lose reliability during extreme volatility. Caution is advised during major economic releases.
Conclusion
Mastering vwap can transform the way you interpret price action. Instead of reacting emotionally to rapid moves, you gain a structured framework for understanding fair value and institutional behavior.
It shines in intraday trading by defining bias, identifying pullbacks, and exposing overextended conditions. Yet like any tool, it works best when combined with discipline, context, and risk control.
Markets will always fluctuate. But when you understand where the average participant stands, you trade with awareness instead of uncertainty—and that edge makes all the difference.